In the years since the onset of the COVID-19 pandemic, changes in traditional TV viewership have been a hot topic. It is well-established at this point that behavioral changes (remote work, etc.), combined with the rise of digital streaming services have led to erosion of traditional TV viewership.
How many impressions have we lost?
When it comes to tracking traditional TV viewership erosion, one measure we can use is HUT – Households Using Television. Using this measure allows us to view market-wide trends instead of focusing on individual stations.
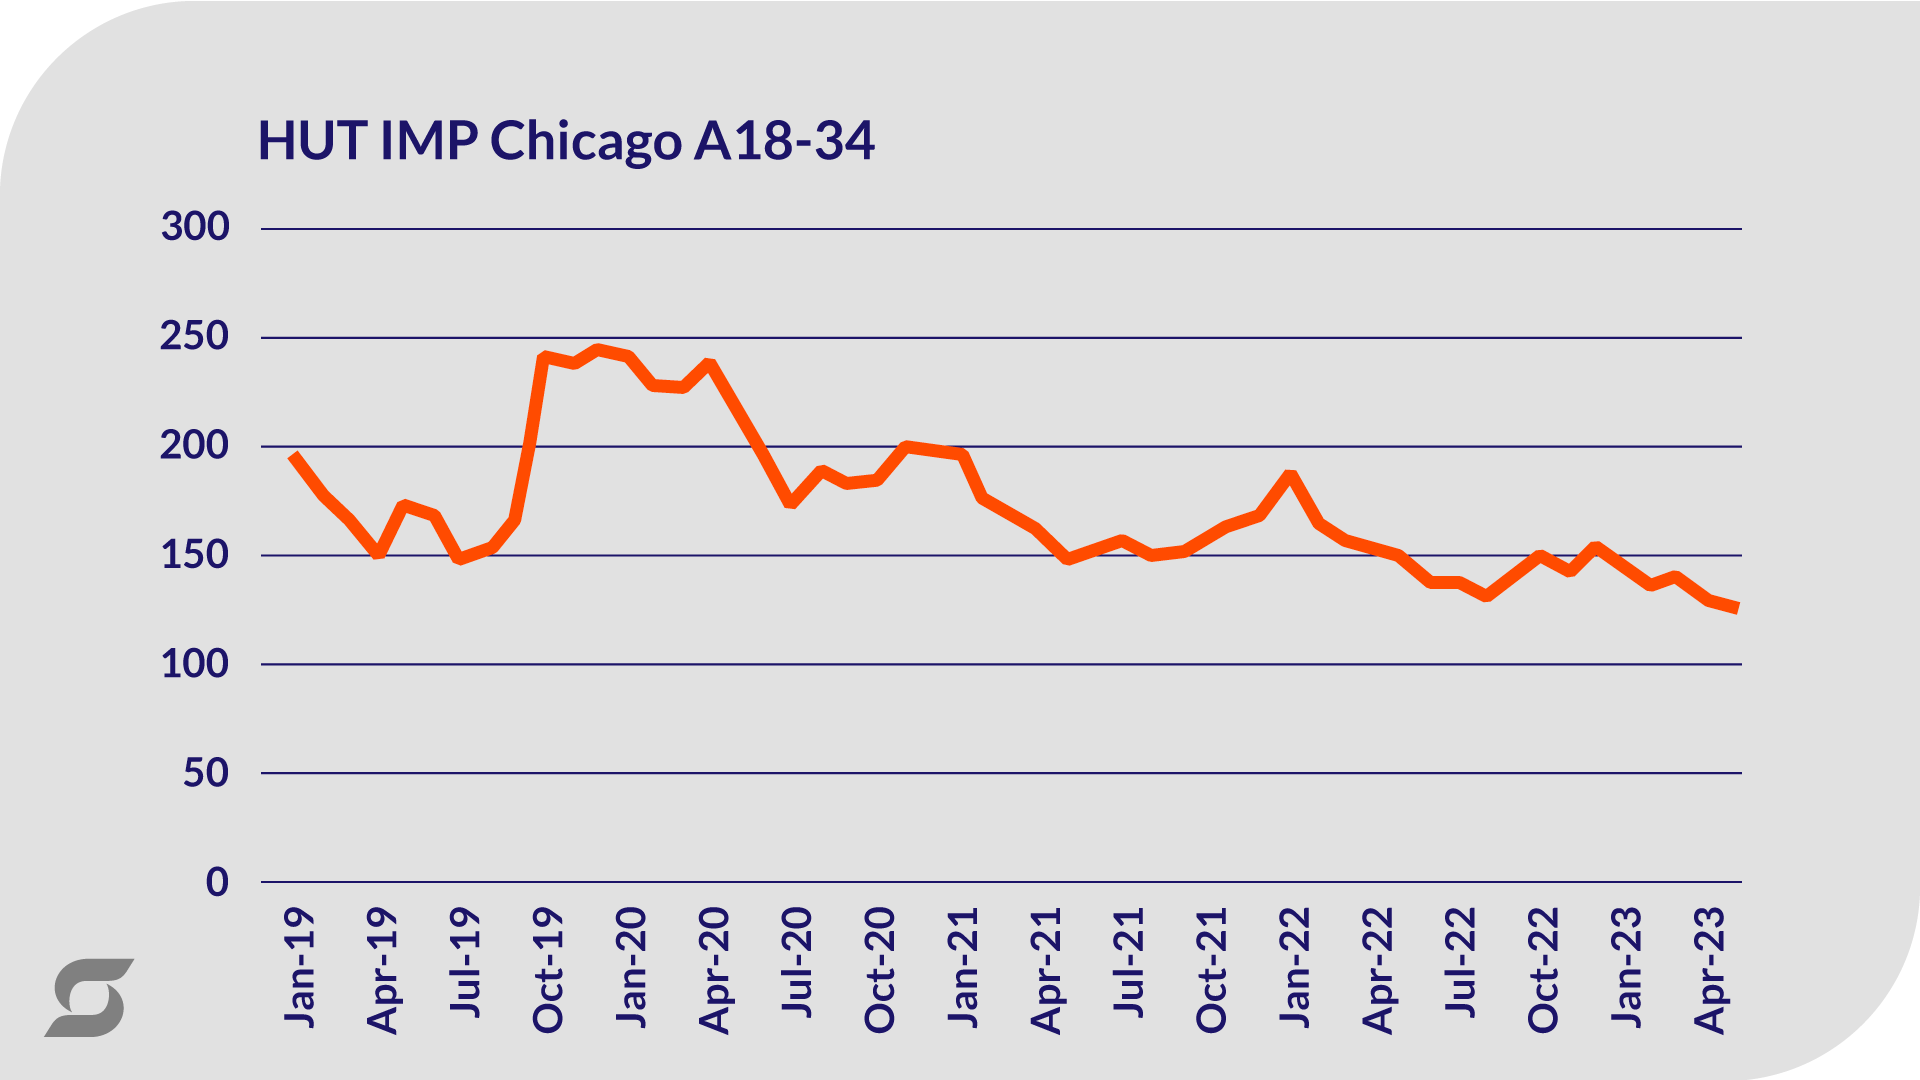
In this piece we will look at data for Chicago with a demographic of adults 35-64 and track impression data from January 2019-May 2023. Using a broad schedule of 6a-12m, we can track media performance by applying the monthly ratings books from Nielsen.
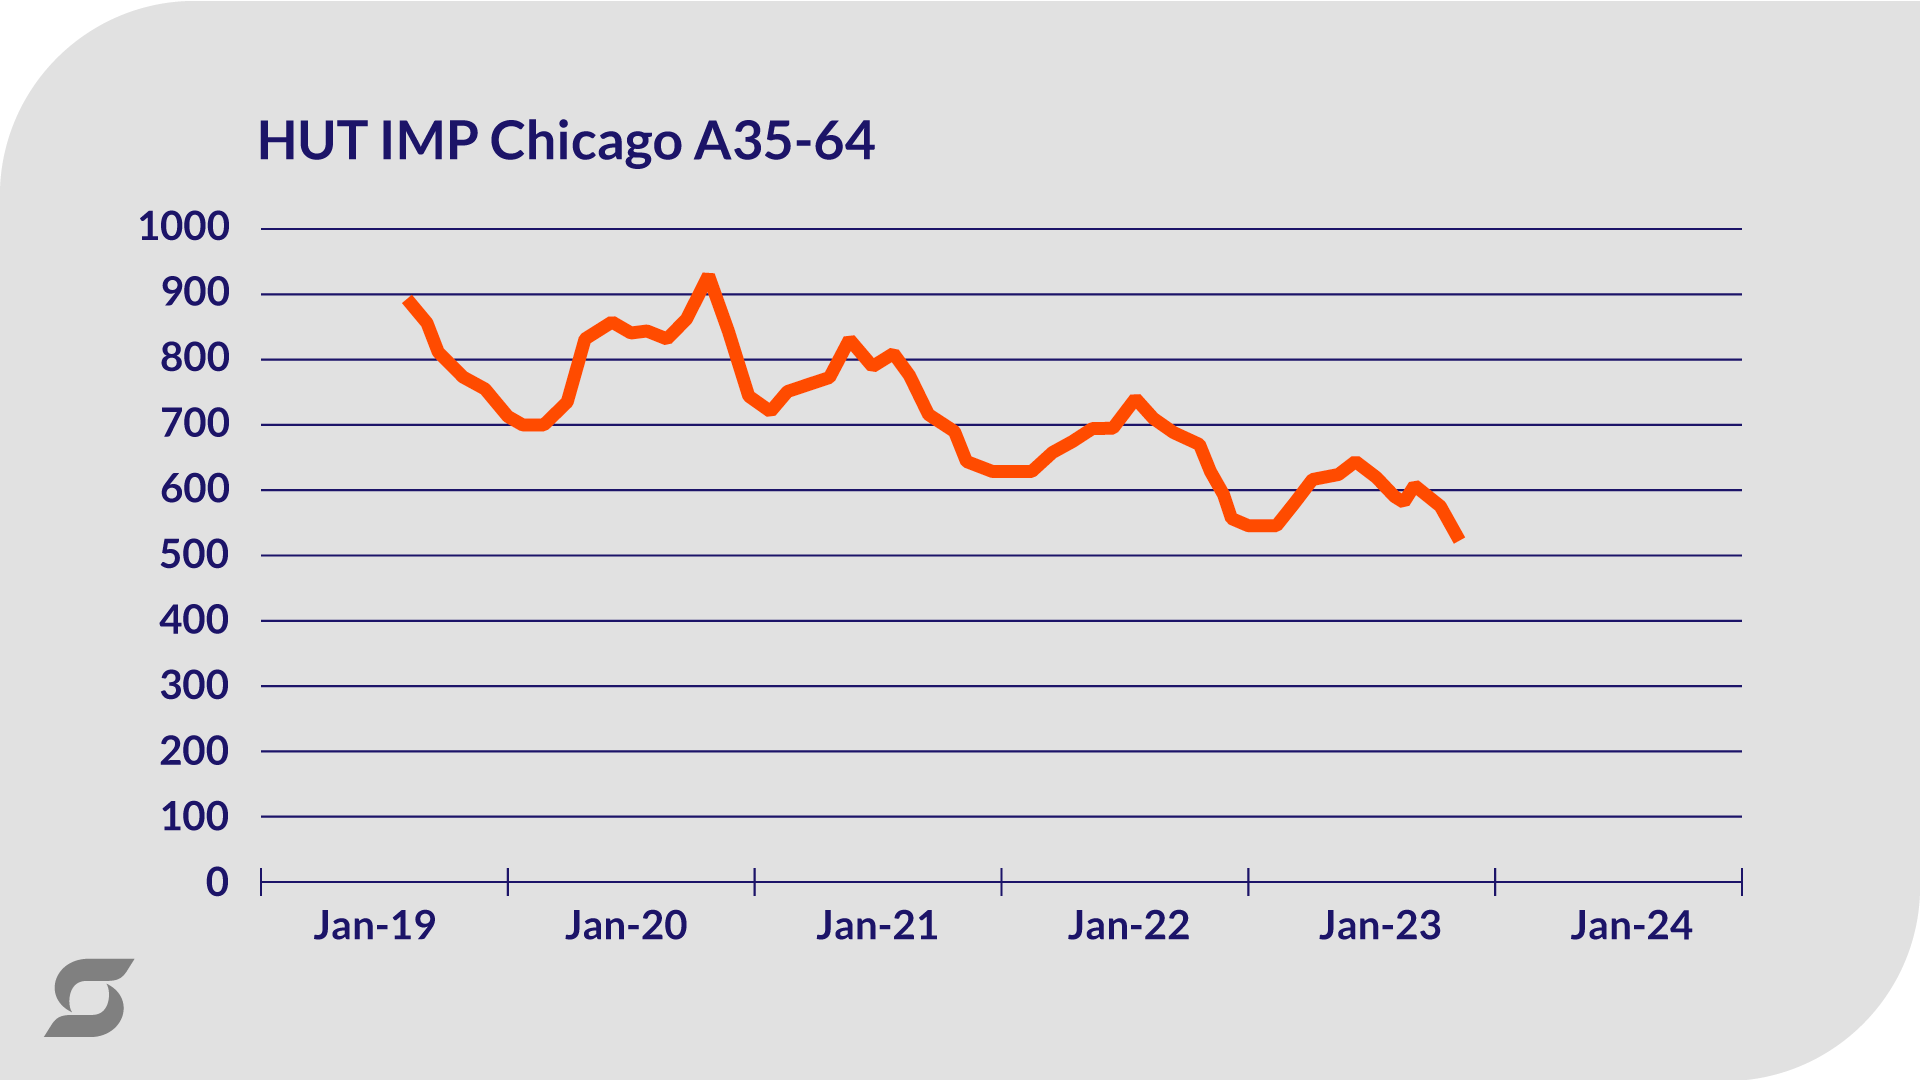
Charting the impression delivery from our sample schedule illustrates the downward trend pretty clearly. There are inflection points around significant events like March 2020 (beginning of the Covid-19 pandemic) and November 2020 (the Presidential election), but even with seasonal ups and downs, the overall trend is negative. In fact, from January 2019 to May 2023, impressions for adults 35-64 have dropped just over 40%.
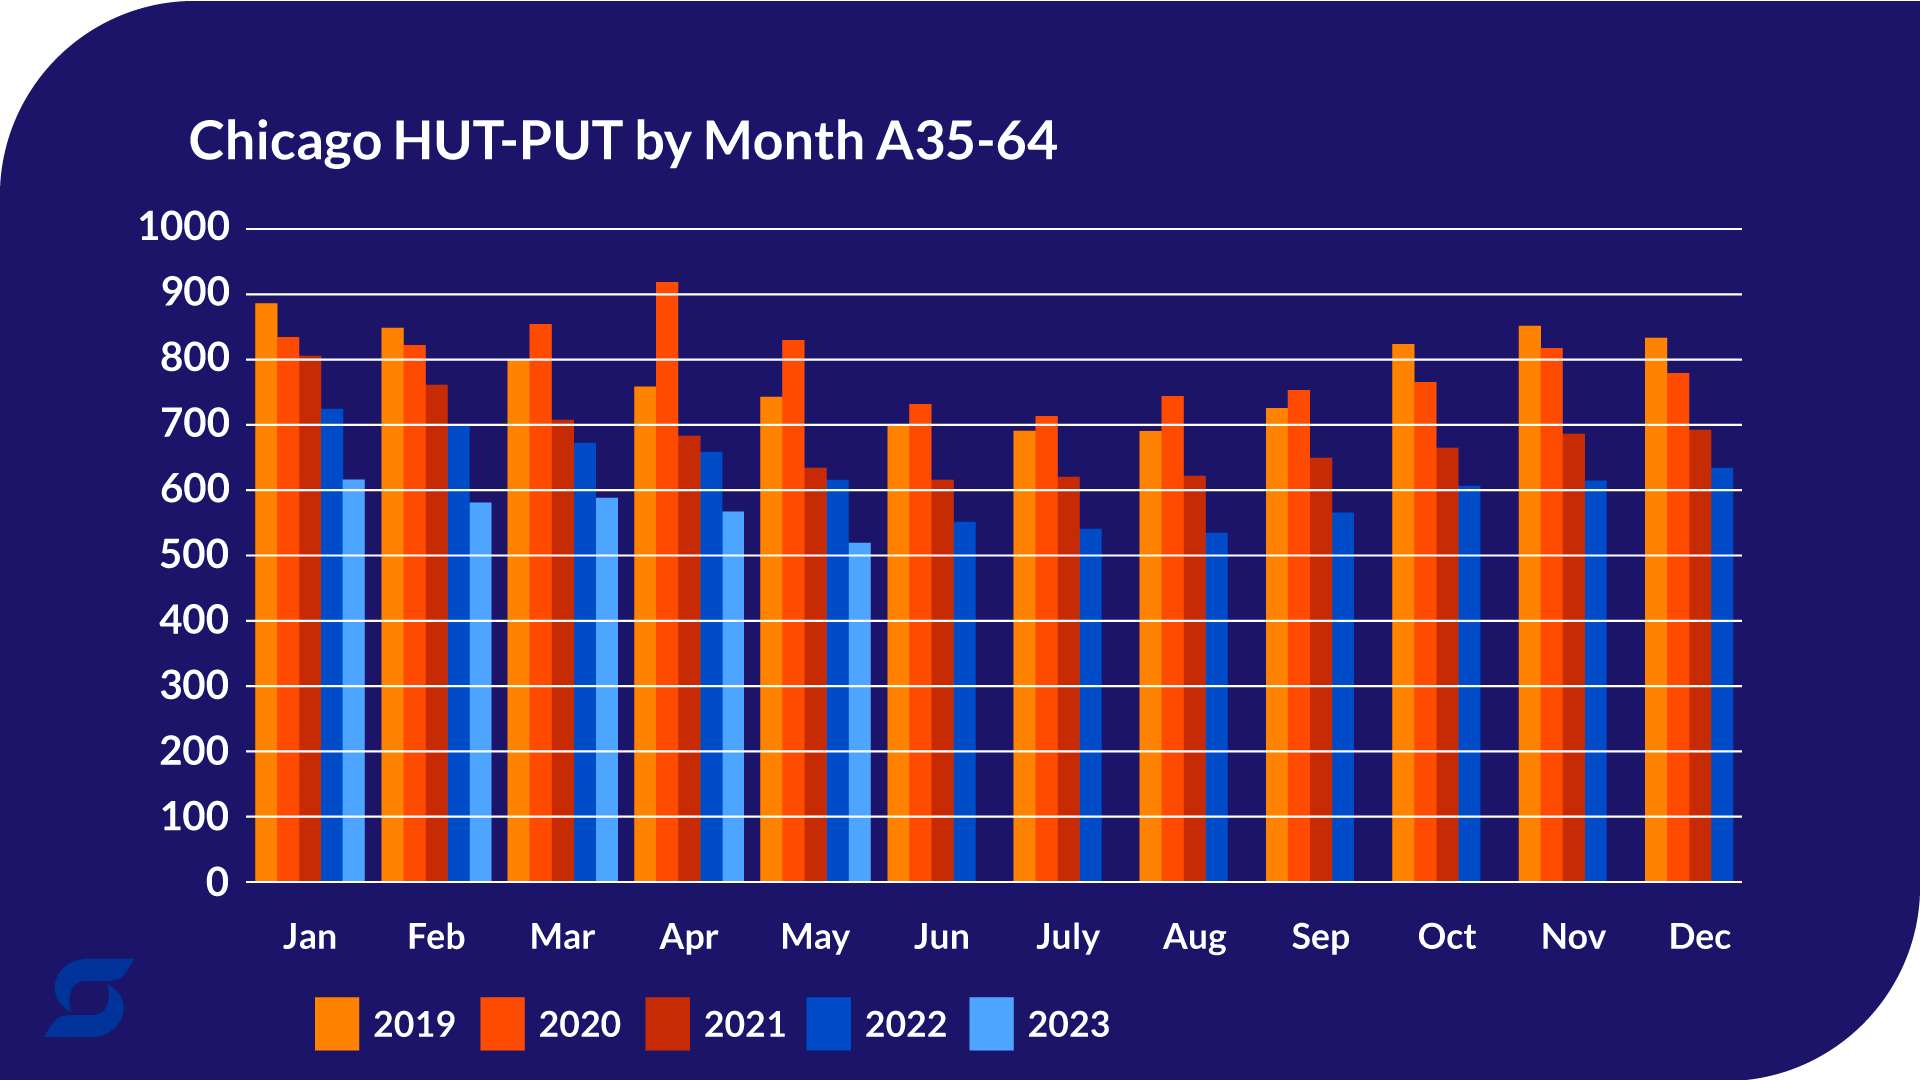
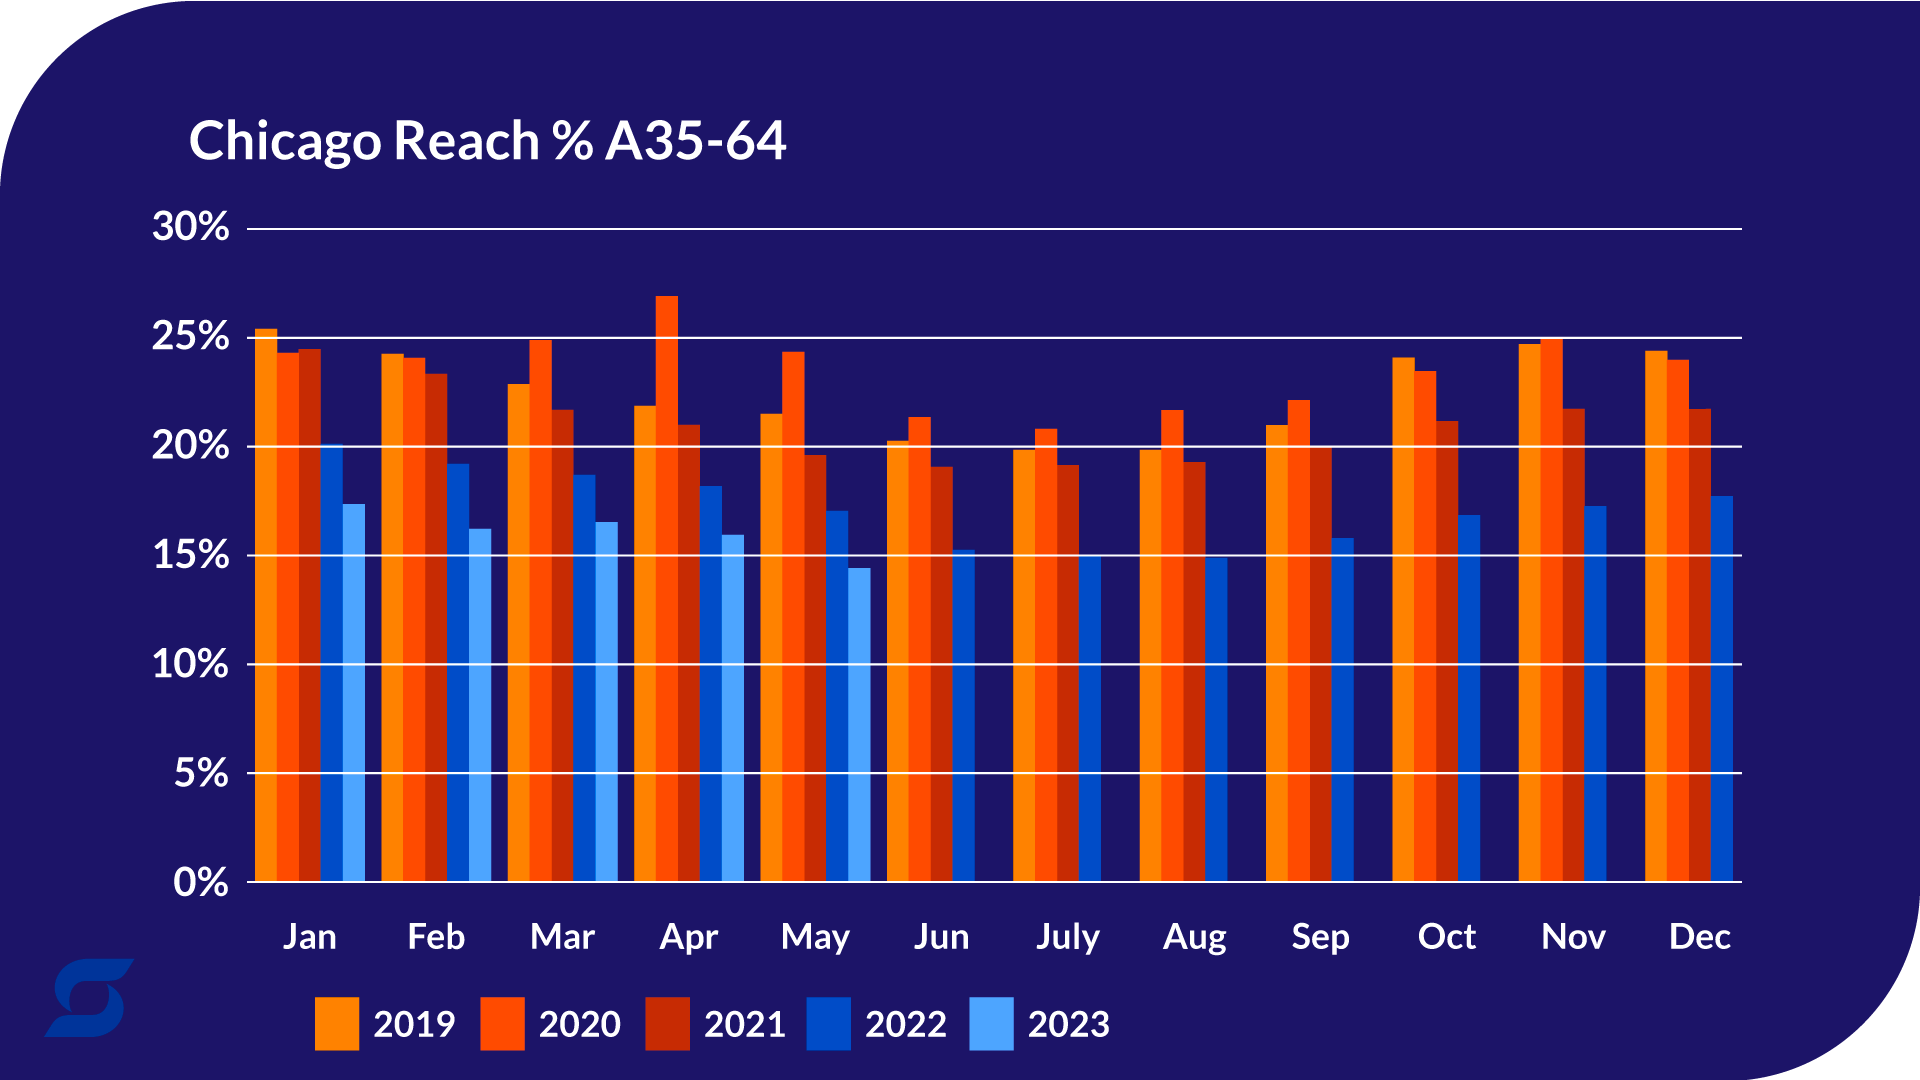
We can also visualize these trends by month and compare impression numbers year over year. In many cases, the impressions went up from 2019 to 2020, but have been on a decline ever since, falling well below 2019 levels. From May 2022 to May 2023, impressions have dropped 15%.
What about beyond impressions?
We can also use the HUT data to track metrics besides impressions. One such metric is Reach % – the unduplicated percentage of the audience that viewed a given media plan. Using that same sample schedule, we can see what percent of the audience would have viewed our media each month. Much like impressions, there was a spike in the early months of 2020, but the overall trend is negative since Q1 of 2020.
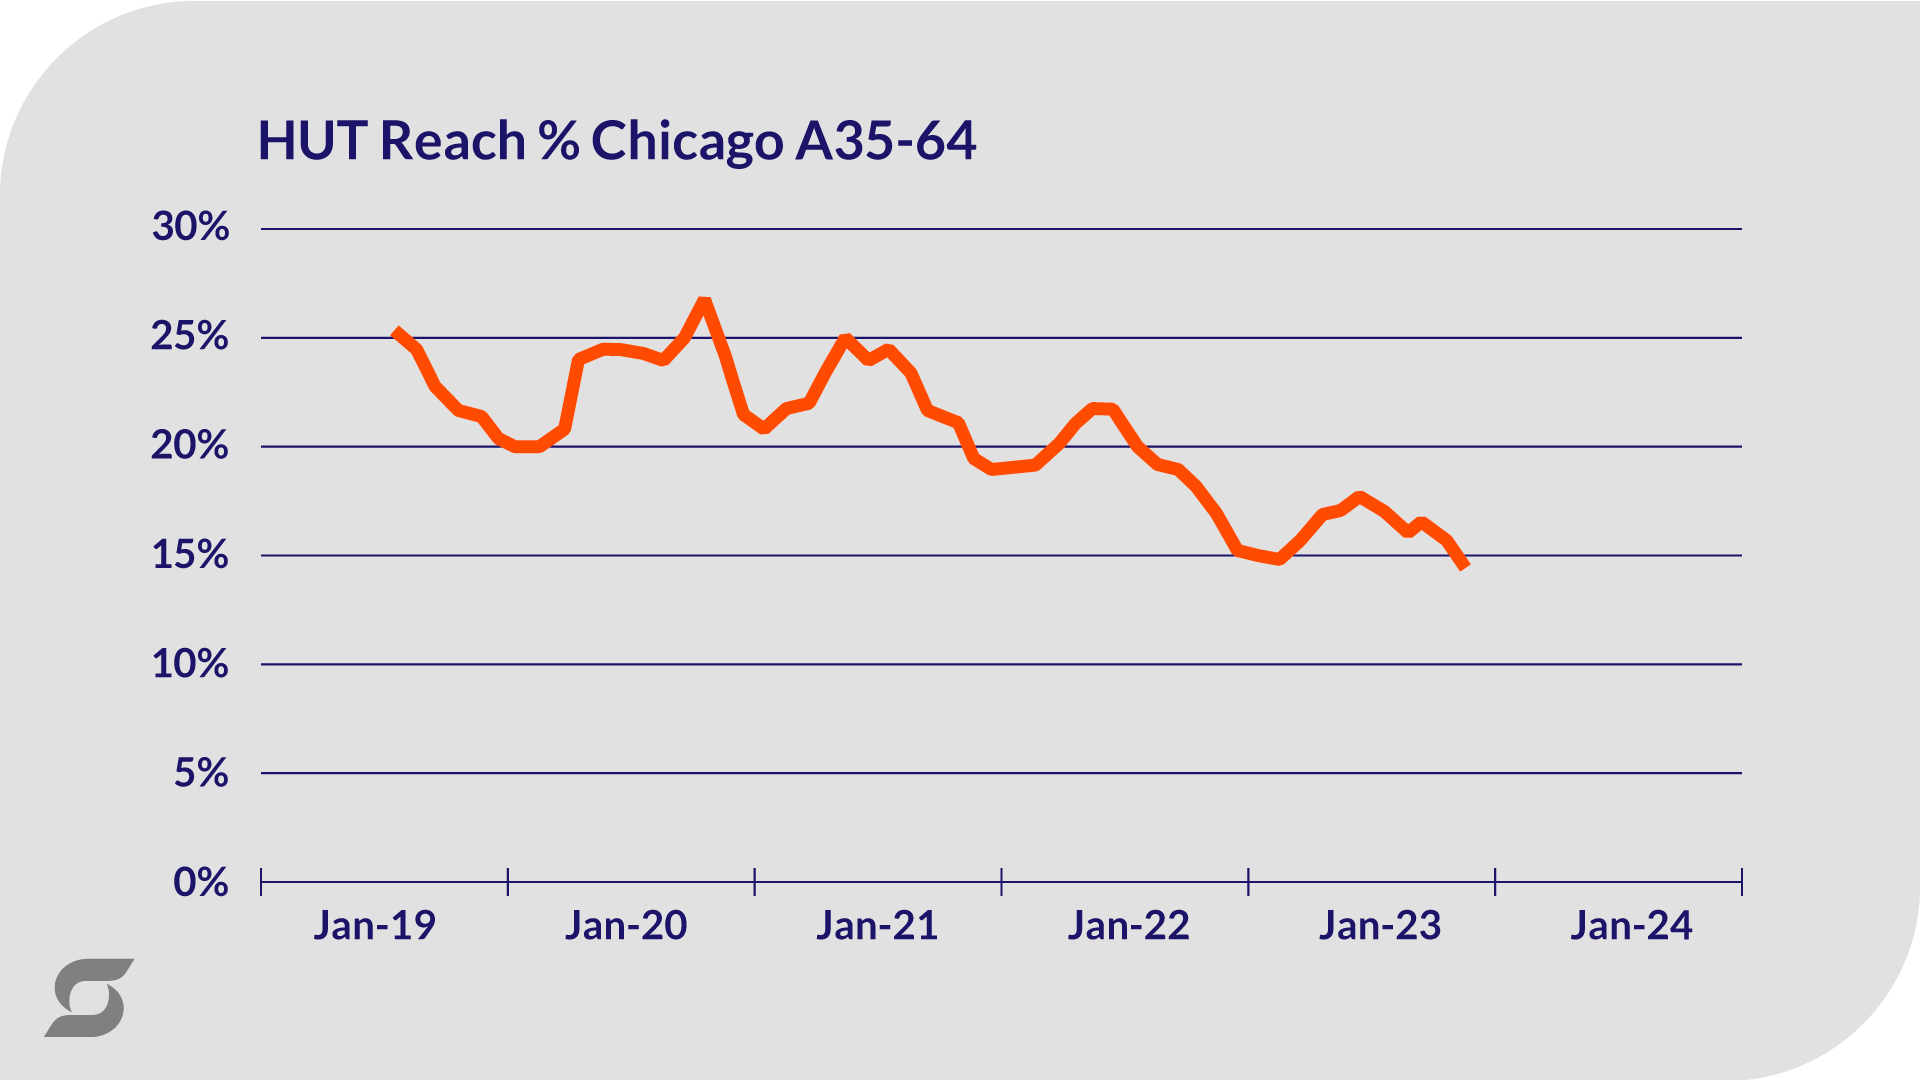
From January 2019 to May 2023, reach has dropped from 25% to just under 15%. Over this time period, traditional TV in Chicago is reaching nearly 43% people. With a year over year breakout, the drop-offs from 2020 to 2021 and 2022 to 2023 look particularly precipitous.
Is traditional TV still a place we want to be?
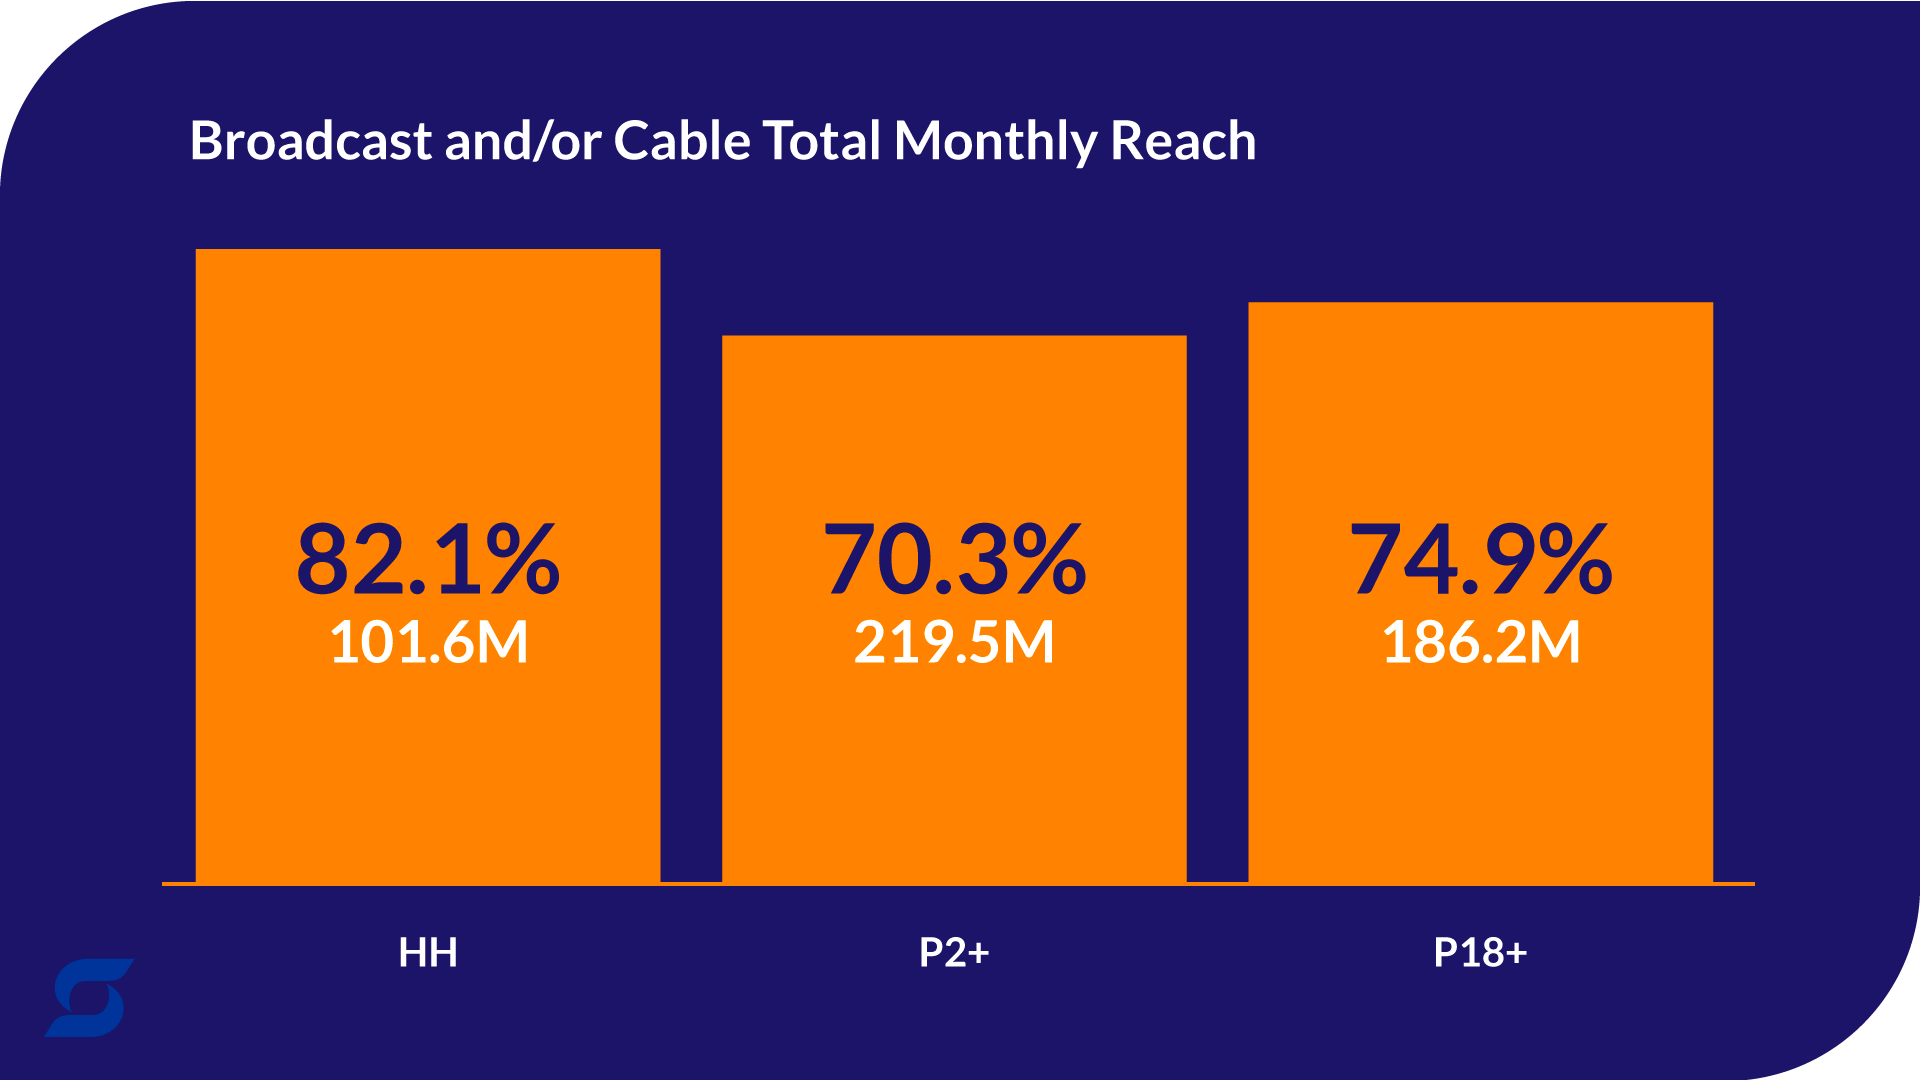
Tracking traditional TV viewership erosion begs the question: with a shrinking audience, is TV still a place we want to be? The answer remains a resounding yes. Even if TV impressions are shrinking, the platform still maintains a massive audience, with unique content like news, live sports, and more. TV (broadcast + cable) reaches nearly 75% of persons 18+ monthly.
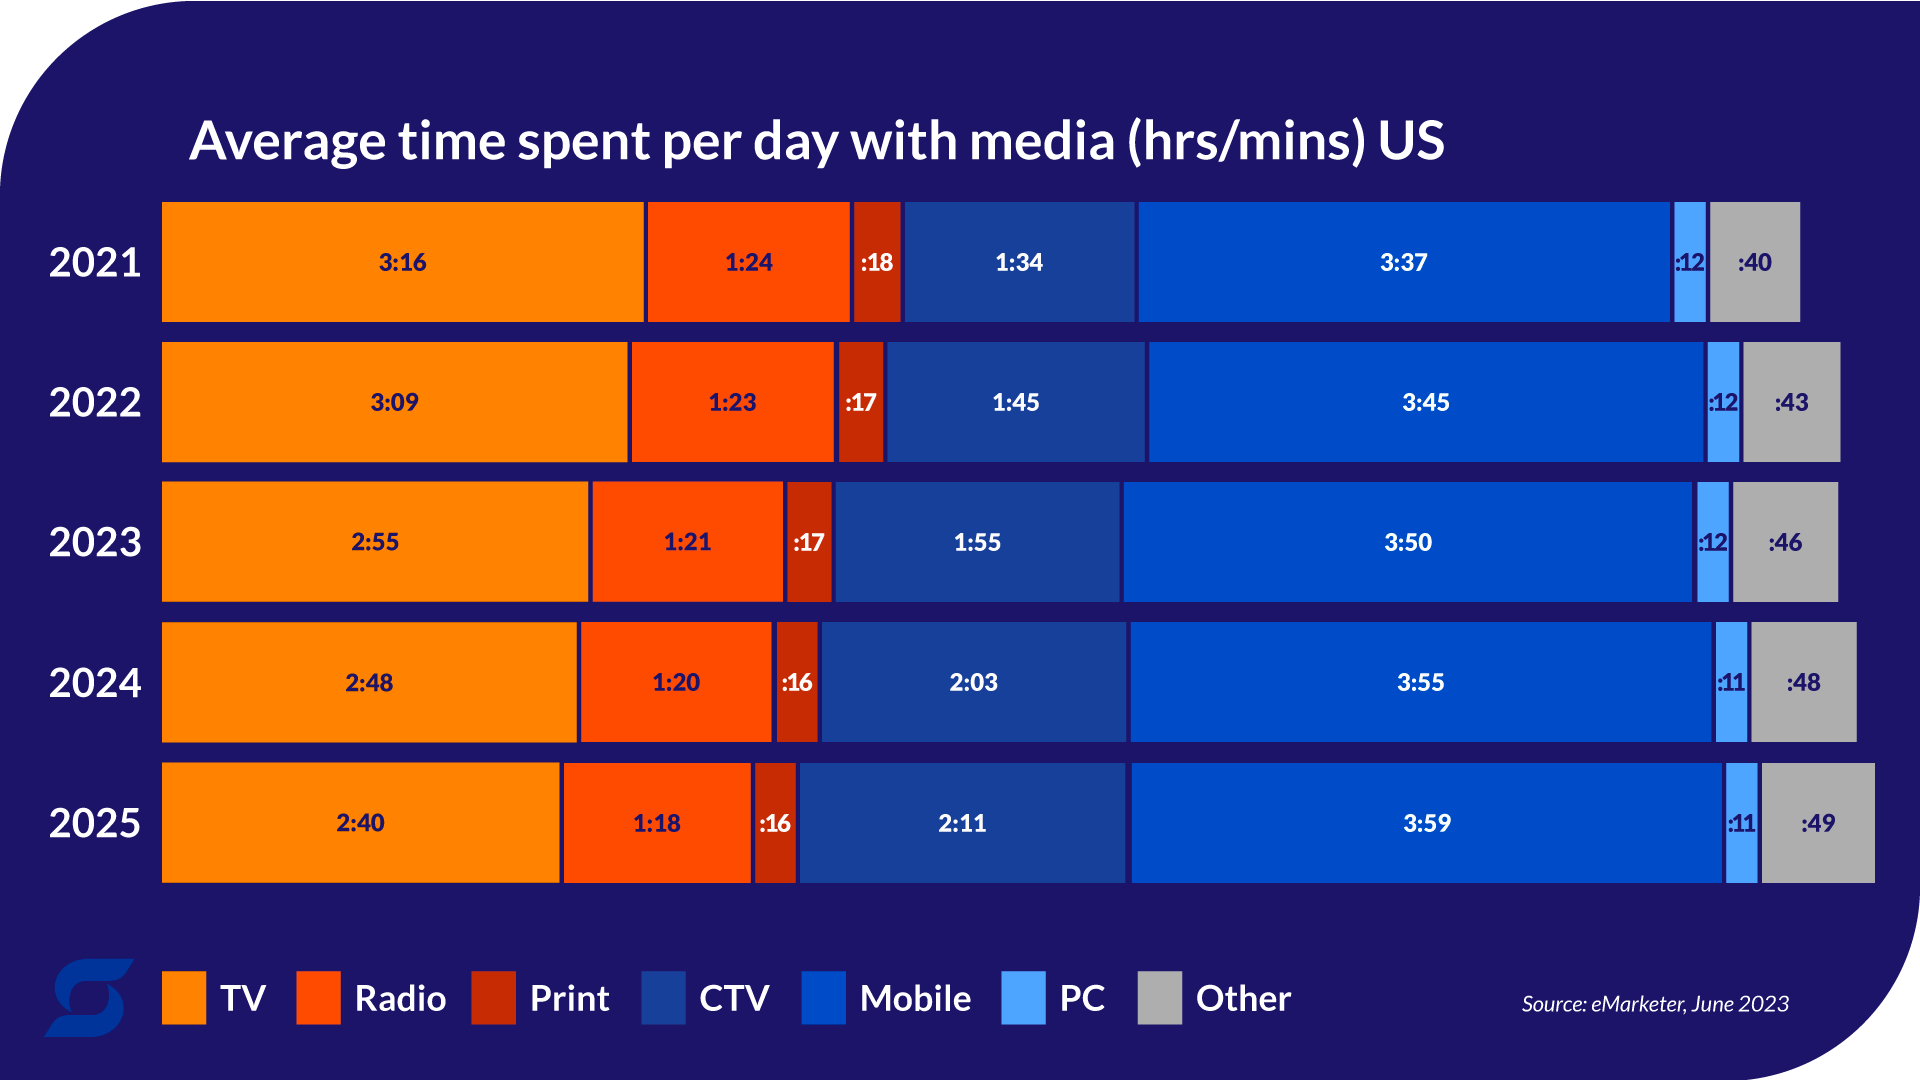
Another important metric to consider is the share of TV relative to other mediums. Average time spent with TV might be going down, but it still eclipses radio and CTV in 2023 and is projected to maintain that lead in the coming years. In terms of both audience size and the broader media landscape, television still has tremendous influence and potential.
Although we remain bullish on TV, it is important to consider your target audience as well. If we look at adults 18-34 instead of adults 35-64, the decline in impressions is more pronounced. Impressions for this younger demo peaked in early 2020 and over the course of the next 3.5 years fell just shy of 50% (January 2020 to May 2023). Compare that to a 37% drop in adults 35-64 over the same time period. The younger audience is leaving TV at a faster rate.
What’s next?
First and foremost, it is critical to be aware of these trends when negotiating new TV deals. Declining impressions means rates and CPMs must reflect the changing audience as well. Paying the same rates for fewer impressions will not help results.
Second, understanding the shrinking TV audience can alert us to how many impressions we may need to make up elsewhere. Perhaps a 10% decline in TV impressions necessitates a 10% increase in connected TV spend. Finding the right media mix is critical to client success, and understanding trends in television performance (like this 2022 takeaway on streaming) helps guide decision making for other media options like radio, connected TV, paid search, etc.
As you continue to develop your media strategy, it is vital to consider traditional TV viewership erosion, combined with TV’s impact relative to other media.
Get in touch to learn more about how Scale Marketing uses insights to drive growth and business results for companies like yours.